SAN ANTONIO
AUTO SHOW
Social Media Management, Paid Ad Management
Overview
The San Antonio Auto and Truck Show is an annual 4-day event hosted at the Henry B. Gonzalez Convention Center in downtown San Antonio every November.
In 2016, 2017, and 2018, I led the charge in managing the show's social media marketing efforts, both from an organic and paid social media perspective.
Thanks to an unwavering emphasis on A/B testing for different audiences, well-timed ads, and the use of visually captivating, story-telling content, the 2018 show set a new ticket sales record.
Specfically, my efforts directly contributed to a revenue of $11,684 from online tickets alone - a 195% return from an ad spend of $3,959. This means that every $1 invested generated a return of $2.95 in online ticket sales. Please note, this figure doesn't even include the ticket purchases made off-line at the event - so the actual revenue generated from ad efforts was likely far higher.
Below is an overview of what went into 2018's strategy and how we pulled it off.
.jpg)
SETTING THE STAGE - JULY THROUGH SEPTEMBER
While account management for the show began in July, the bulk of our advertising budget was strategically reserved for October and November (the month of the show).
Prior to this crescendo, my approach for July through September focused solely on lightly boosted organic content.
The primary goal of this content was to stir up overall buzz and general awareness of the show.
Broad Hype and Excitement
Photos were carefully selected with the overall goal of conveying the show as a world-class, vibrant event, brimming with high-quality vehicles, lively visitors, and infectious fun:


In addition, photos were carefully cropped and edited to amplify their colors to be a more radiant, vibrant hue.
Strict, daily adherence to this extremely high bar of "story-telling" quality was crucial in weaving the overall, big picture of what the show was all about and instilling an essence of professionalism, quality and "expectation of greatness" in the minds of viewers.


An underrated (and under-appreciated) aspect of social media management is the ability to discern what constitutes "high-quality." This means only posting content that stirs viewers' senses, sparks their imaginations, piques their curiosity, and ignites enthusiasm.
This is one of my core philosophies as a social media manager - consistency in posting high-quality, emotive, story-telling content breeds greatness and trust in your followers. There can never be "throw-away" posts.
Every post matters and builds upon what was posted before.
Vendor Recruitment

During this time, we also ran a series of lightly boosted posts focused on inviting San Antonio's vintage car community to showcase their vehicles at the show.
This outreach successfully resulted in 20+ local antique auto owners enthusiastically committing their rare vehicles to be displayed at the show.
OCTOBER 2018 - PRIMING THE PUMP
In October we gained more promotional fodder, with an early celebrity guest appearance to announce, as well as promotional video content to promote.
We also launched an Early Bird ticket sale to begin racking up sales. Additionally, October was when we launched the show's official Facebook Event.
Early Exhibitor/Special Guest Announcements

A key early announcement was securing celebrity guest appearances of the stars of the hit TV show "Gas Monkey Garage." To maximize exposure of the news, we ran a lightly boosted ad campaign targeting "Gas Monkey Garage" fans living in the San Antonio area.
This strategic promotion yielded tremendous engagement, garnering over 70 comments and 85 shares, highlighted inside the red box above.
Displayed below is the Facebook audience creation interface and the audience parameters I set for the campaign:

As you can see in the red squares above, we targeted male and female fans of "Gas Monkey Garage" living within 25 miles of San Antonio. The audience size of this parameter was an estimated size of 19,500 - 23,000. There's no wonder why the ad performed so well!
Early Bird Ticket Sales


For our Early Bird Ticket promo, we mixed it up and tested different creative formats (graphic vs picture only, videos vs non videos, rectangle size vs square size) to see which creative type would generate the lowest cost per ticket sale.
I detail more further down on how Facebook's ad hierarchy and audience types work, but the key takeaway was that the $957 spent on Early Bird ticket sales ads generated 108 ticket purchases, worth $2,514 in sales. This is highlighted in the below snapshot of Facebook's Ad Manager interface:
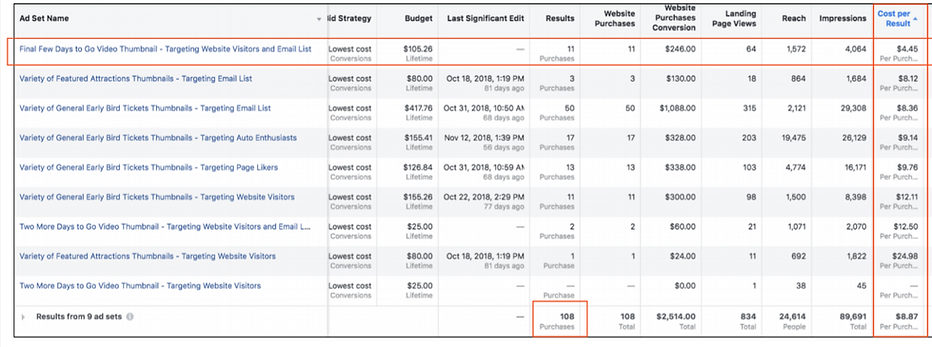
Each row above is associated with a different audience targeted. Within each row lived a plethora of different ads being displayed. The bottom blue row displays the total results for our Early Bird Ticket campaign:
-
Purchases: 108
-
Online Ticket Sales: $2,514
-
Website Visits: 834
-
Reach: 24,614 Unique Individuals,
-
Impressions (non-unique total number of views): 89,691
-
Average Times Each Unique Individual Saw an Auto Show Ad: 3.65
-
Cost Per Ticket Sold: $8.87
Of all the different ads tested, we found that ads targeting Website Visitors, using video, generated the lowest cost per ticket sale of $4.45 (compared to the overall average of $8.87). As such, once we saw this, we shifted our funds so that these ads received the lion's share of the allotted Early Bird ticket sale budget. These results are highlighted below:

Chuck Cureau - Social Media Videos

For the first time ever, we hired a spokesperson, social media "hype-guy" to generate fun man-on-the-street style interview videos to generate buzz for the event.
The hype-guy, Chuck Cureau, famous for being the San Antonio Spurs' emcee for all home-games, would go to different San Antonio area events and create fun interview videos with normal, everyday people.

Even though Chuck is quite the catch for hiring to do these types of videos, anyone can do them - all it takes is a microphone, an iPhone, bravery, enthusiasm, and a good dash of charisma.
While these videos were fun to make and did wonders for brand perception for the show, the return probably wasn't worth it considering all the effort and time that went into all the videos' creations.
Facebook Event

In October we posted a Facebook Event for the show and used a slice of the ad budget to begin promoting it.
A Facebook Event is a digital tool offered by Facebook that allows businesses to create, promote, and manage events directly on Facebook. Think of it as your online event flyer, invitation system, RSVP tracker, and discussion board for your event, all rolled into one.
While ultimately the most important place to direct viewers to is a link where they can purchase tickets, Facebook Events are vitally important for putting your event on the map, making it discoverable by the masses, and truly solidifying it as an official, "actual" event on the horizon.
NOVEMBER 2018 - OPENING THE FLOOD GATES - A QUICK PRIMER
When November rolled around, things really revved up.
Below is an overview of the different campaigns we ran in November, each focused on a different objective, including:
-
Ticket Sale conversions
-
Facebook Event Responses
-
Website Traffic
-
Reach
-
Post Engagement (meaning Likes, Shares, and Comments).
Please note, this table is easier to read when viewed on a desktop:

Each row above represents a campaign that we ran in November - so five campaigns total.
A quick primer on Facebook's ad hierarchy before we get into the nitty gritty:
Facebook's advertising hierarchy, from the Campaign level down to the individual Ad level, is structured in a way that allows you to categorize and separate out different marketing objectives, target audiences, and creative elements. This allows advertisers' straightforward navigation and control over various aspects of an advertising strategy.
The Campaign is the highest level of the hierarchy. Within a Campaign are Ad Sets, and within Ad Sets, are Ads. Here's an explanation of each level:
-
Campaigns: At the highest level are Campaigns. Each Campaign you create is tied to an overarching objective.
Facebook provides a range of Objectives (essentially what you want people to do when they see your ads) to choose from. The Objective types are Awareness, Consideration, and Conversion.
Within Campaigns are Ad Sets.
-
Ad Sets: Within each Campaign can be multiple Ad Sets. Ad Sets are where you define your target audience, budget, schedule, bidding, and placement of ads. For example, in an Awareness campaign, you might have one Ad Set targeting people aged 18-24 in New York, using Instagram as the placement. In another Ad Set, you may target people aged 25-34 in Los Angeles, with Facebook as the placement.
-
Ads: Within each Ad Set are individual Ads. This is where you design the actual ad - the images, videos, text, and call-to-action buttons you want to use. For example, under the Ad Set targeting 18-24 year olds in New York, you might have one ad with youthful imagery and another ad with more professional imagery. Both of these ads live within the 18-24 year old New Yorker Ad Set.
By dividing your Facebook Ads into Campaigns, Ad Sets, and Ads, advertisers are better able to create different strategies for different objectives. This allows advertisers to control and test different variables within each strategy to see what works best, ultimately making it easier to optimize your ads.
NOVEMBER 2018 - OUR CONVERSION FOCUSED CAMPAIGN
Overall we ran five campaigns in November. The most important and impactful campaign of them all (from an online ticket sales perspective) was our Conversion Campaign.
What exactly are "Conversions"? Conversions are any action that a user takes on your website, app, or Facebook page, after clicking on your ad. In this case, the Conversion we set was the completion of an actual online ticket purchase.
The Conversion Campaign is highlighted in red below:

Within the Campaign, I ran different Ad Sets, each targeting different audiences:

Testing ads on different audiences is crucial as it allows you to identify which demographic/audience generates the lowest cost per sale. This allows me to optimize ads so that the best-performing audience receives the majority of ad dollars.
Ad Sets are perfect for this, as it allows me to easily redistribute ad spend to the top performing audience.
Here's the different Audiences I targeted:
-
2016 and 2017 San Antonio Auto Show ticket purchasers - The Auto Show has a list of all customers that purchased tickets for the prior two years, along with their email addresses. Facebook allows you to upload this list into their system. It then automatically matches the ticket purchasers' email address with their Facebook account. We're then able to target those individuals.
-
The Auto Show’s existing email list - Throughout 2018, and in prior years, the Auto Show collected email addresses for their monthly newsletter. Just like we did for the prior year ticket purchasers described above, we uploaded this newsletter email list into Facebook. Facebook then generated an "audience" made up of these individuals that we were then able to target.
-
Website traffic visitors within the past 180 days - Facebook allows you to target people who have actually visited your website. We're able to do this by placing a pixel (line of code) on the Auto Show's website's backend. This pixel then collects all the people who have visited your site and matches their data with their Facebook account. We're then able to target these folks.
-
Facebook event page RSVPers - Facebook allowed us to target all individuals who RSVP'ed to the Auto Show's Facebook Event (described earlier). This is an amazing audience to work with as these people have already signaled that they're very interested in attending the event.
-
Facebook and Instagram page likers - Facebook allows you to target all the different people who have "Liked" or "Followed" the Auto Show's page over the years. In this case, it was a juicy 20,000 people we were able to target.
-
Auto enthusiasts - Via Facebook itself, you can target different "interest groups" by location and demographics. In this case, we targeted everyone with an interest in the auto industry that lived within 50 miles of San Antonio.
As you can see below, the Website Visitor audience performed the best, generating a cost per ticket purchase of $3.62 - generating $2,364 in ticket sales. Good for a ROAS (Return on Ad Spend) of 6.53x.

Within these Ad Sets, like the one screenshotted above, I was able to test all different types of Ad creative. Whether it was professional or raw, user-generated photos, video content or graphic content, hyper-focused content or broader content - I was able to test a wide variety of creative to see what type generated the lowest cost per ticket sale.
As the results came in, I would flip off the lowest performing ads and keep up the highest-performing ads so that more of the budget would automatically flow into what worked.
When it comes to testing ads, it's always the more the better. Here's an under-the-hood look at the different types of ads I tested within each Ad Set:

The purpose of sharing this "way-too-small-to-read" view is to show the breadth and depth of the different types of ads we ran and tested - a lot!
It's all about testing and having an open, humble mindset to rely on what the data says - not your ego.
In the case of the Auto Show, it was thumbnail sized video content that performed the best.
Timing is Everything
From a timing perspective, we found that the closer to the show the ads ran, the lower the Cost Per Sale.
Here's what the Cost Per Ticket sold was on each day during the week of the show (the event took place on Thursday, 11/15 through Sunday, 11/15):
-
Monday, 11/12 - $6.72 Cost Per Ticket Sold
-
Tuesday, 11/13 - $9.56 Cost Per Ticket Sold
-
Wednesday, 11/14 - $12.88 Cost Per Ticket Sold
-
Thursday, 11/15 (Day #1 of Event) - $4.57 Cost Per Ticket Sold
-
Friday, 11/16 (Day #2 of Event) - $4.15 Cost Per Ticket Sold
-
Saturday, 11/17 (Day #3 of Event) - $3.58 Cost Per Ticket Sold
-
Sunday, 11/18 (Day #4 of Event) - $4.47 Cost Per Ticket Sold
Timing is everything. Urgency spurs sales when it comes to festivals and consumer events like the Auto Show.
WRAPPING EVERYTHING UP - OVERALL RESULTS
Wrapping everything up, here were the final ticket sales were combining all Campaigns, even those Campaigns where online-ticket sales weren't the primary goal:
-
Purchases: 506
-
Online Ticket Sales: $11,684
-
Website Visits: 7,171
-
Unique Individuals Reached: 167,602
-
Impressions (non-unique total number of views): 881,060
-
Average Times Each Unique Individual Saw an Auto Show Ad: 5.25
Overall it was a huge success and resulted in the show's most attended event ever.
2018 was my final year working on the Auto Show (I left the marketing agency in 2019), so I wasn't able to implement all that I learned for the show's future years, but the lessons learned here generally apply to all types of events and festivals.
Interested in receiving this caliber of marketing support for your event or festival? Schedule a Free Consultation with me where I'll do a deep dive into your event and craft a marketing plan forward for you.